.
The new starting page of your workday
Guard Cloud
Our solutions
All key figures in one place
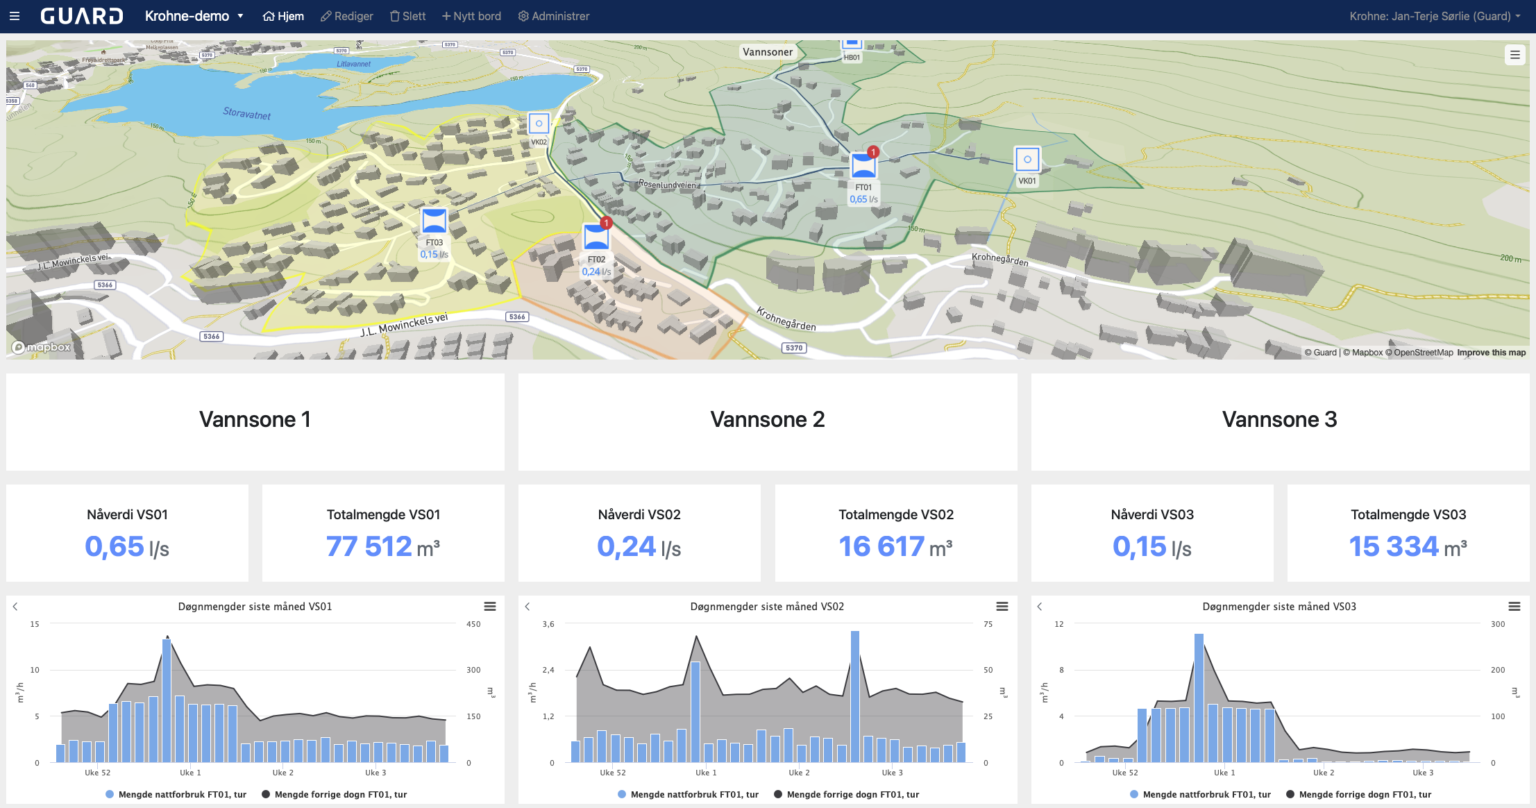
Dashboard provides a quick overview of all key figures in a modern and intuitive user interface. Users can add charts, lists, and graphics with real-time data from all your connected sources and share them with others in their organization or as information screens. You can even safely embed real-time data from Dashboard in your own webpage to show the public how well you are performing.
Dashboards can also present video surveillance and other web-based systems. The product has a responsive design that makes it work equally well on mobile devices.
You name it, we integrate it.
There is really no limit to what you can embed in your Dashboard. Further to the above, you are free to add anything of interest such as active alarms from your operational control systems, pending tasks from your enterprise asset management system, beautiful views from Maps or other GIS tools, as well as live network graphs from our Networks module.
Or why not add live streams from all your operator panels for full centralized control?
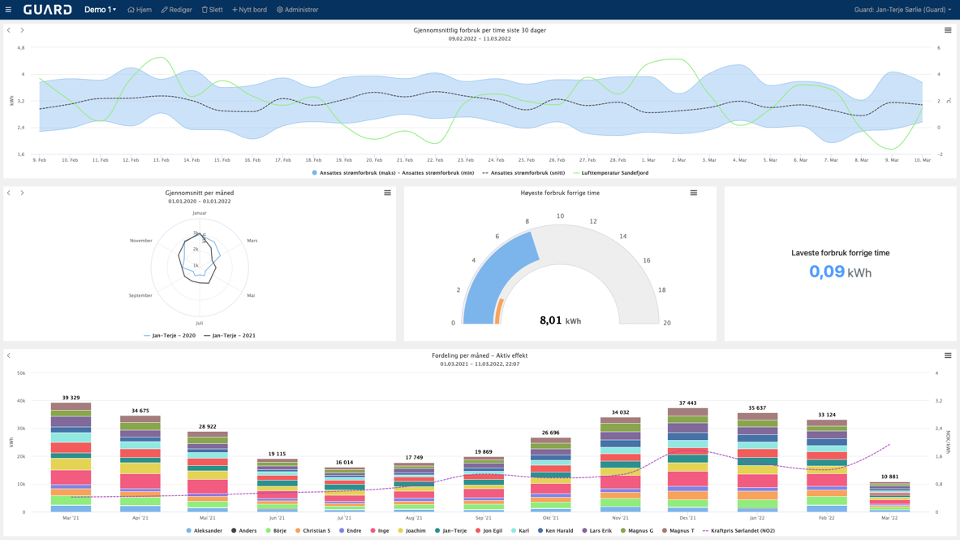
Unleash the power of no-code
Dashboard can be adapted to any industry. And it can all be done by you. Simply drag and drop your desired visualizations and configure relevant time series data with full flexibility in terms of aggregation and arithmetic expressions.